import pandas as pd
import seaborn as sns
import matplotlib.pyplot as plt
# 데이터 불러오기
df = pd.read_csv("marketing_campaign.csv", sep='\t')
# 1. 결측치 처리 (Income 열의 결측치를 중위수로 대체)
df.columns = df.columns.str.strip()
print(df.columns)
print("Income" in df.columns)
df['Income'].fillna(df['Income'].median(), inplace=True)
# 2. 새로운 열 추가 -TotalChildren (Kindhome + Teenhome)
df['TotalChildren'] = df['Kidhome'] + df["Teenhome"]
# TotalChildren 열 추가 후 Kidhome과 Teenhome 삭제
df.drop(['Kidhome','Teenhome'], axis=1, inplace=True)
#3. TotalChildren 그룹화 및 과자 구매량 평균 계산
# 자녀가 있는가구 (TotalChildren>0) 과 없는 가구로 나눔
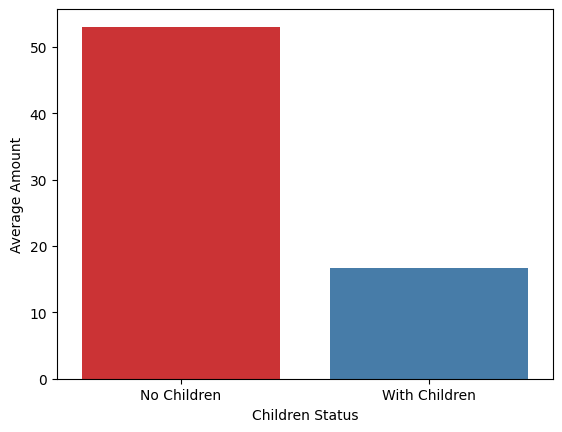
group_means = df.groupby(df['TotalChildren']>0)['MntSweetProducts'].mean()
print("과자 구매량 평균 비교:")
print("자녀가 없는 집 (TotalChildren = 0):", group_means[False])
print("자녀가 있는 집 (TotalChildren > 0):", group_means[True])
# 그룹화 및 평균 계산
group_means = df.groupby(df['TotalChildren'] > 0)['MntSweetProducts'].mean().reset_index()
# 열 이름 수정
group_means.columns = ['HasChildren','AverageSweetProducts']
#바 차트 시각화
sns.barplot(x='HasChildren',y='AverageSweetProducts', data=group_means, palette='Set1')
plt.xticks([0,1],['No Children', 'With Children']) # x축 레이블 변경plt.title('Average Sweet Products Purchased')
plt.ylabel('Average Amount')
plt.xlabel('Children Status')
plt.show()